GO和KEGG分析
GO和KEGG分析
功能富集分析对于解释转录组学数据至关重要。转录组鉴定了差异表达基因后,通常会进行GO或KEGG富集分析,识别这些差异基因的功能或参与调控的通路,来说明关键基因表达上调/或下调后可能会导致哪功能或通路被激活/或抑制,进而与表型进行联系。
(其实就是用DEG结果的进行的分析)
为什么要做GO和KEGG分析
经过差异表达分析,我们得到了在对照组与实验组中差异表达的基因,说明改变的条件对这些基因的表达产生了影响,但是这样还不够,我们希望进一步知道具体是对哪些生物学功能/通路产生了影响,于是需要进行GO分析。
GO、KEGG结果解读
使用R包clusterProfiler进行GO/KEGG富集分析(有参/无参)
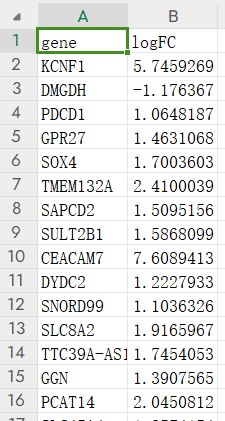
输入数据格式
一个表格,分别是Gene_Symbol和logFC,如下图所示:

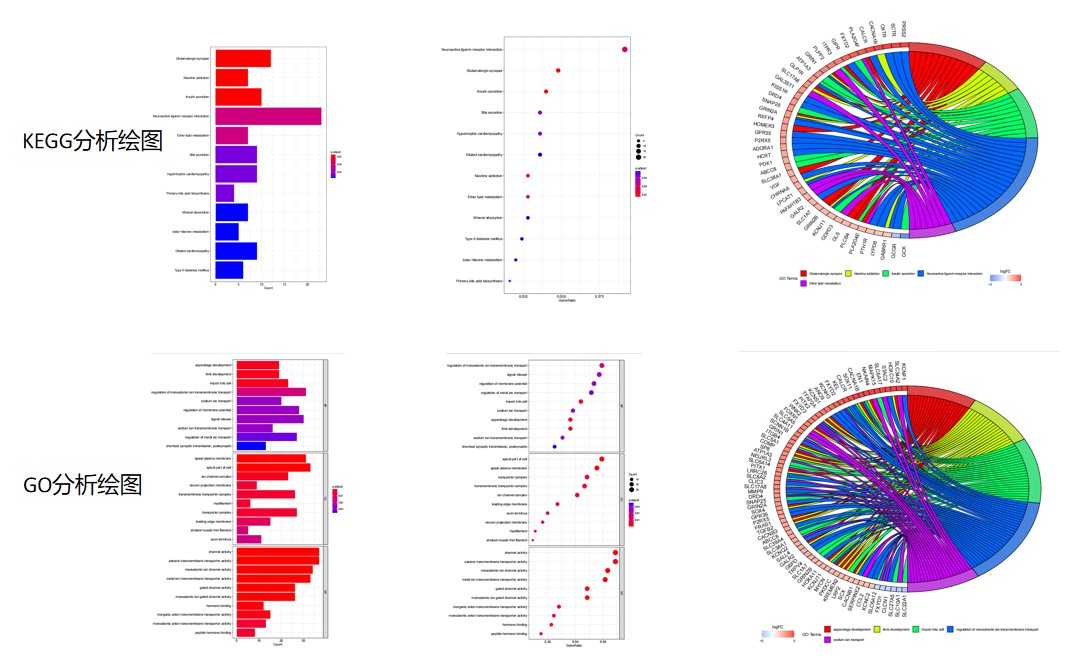
主要结果图

library("clusterProfiler")
library("enrichplot")
library("ggplot2")
library("org.Hs.eg.db")
library("GOplot")

#转换ID
rt=read.table("input.txt",sep="\t",check.names=F,header=T)
genes=as.vector(rt[,1])
entrezIDs <- mget(genes, org.Hs.egSYMBOL2EG, ifnotfound=NA)    #找出基因对应的id
entrezIDs <- as.character(entrezIDs)
out=cbind(rt,entrezID=entrezIDs)
write.table(out,file="GO-id.txt",sep="\t",quote=F,row.names=F)    #输出结果

####GO分析####
rt=read.table("GO-id.txt",sep="\t",header=T,check.names=F)
rt=rt[is.na(rt[,"entrezID"])==F,]
gene=rt$entrezID

#GO富集分析
kk <- enrichGO(gene = gene,OrgDb = org.Hs.eg.db, pvalueCutoff =0.05, qvalueCutoff = 0.05,ont="all",readable =T)
write.table(kk,file="GO.txt",sep="\t",quote=F,row.names = F) #

#可视化
##条形图
pdf(file="GO-barplot.pdf",width = 10,height = 15)
barplot(kk, drop = TRUE, showCategory =10,label_format=100,split="ONTOLOGY") + facet_grid(ONTOLOGY~., scale='free')
dev.off()

##气泡图
pdf(file="GO-bubble.pdf",width = 10,height = 15)
dotplot(kk,showCategory = 10,label_format=100,split="ONTOLOGY") + facet_grid(ONTOLOGY~., scale='free')
dev.off()

##圈图
ego<-read.table("GO.txt",sep="\t",check.names=F,header=T)
go=data.frame(Category ="ALL",ID = ego$ID,Term = ego$Description, Genes = gsub("/", ", ", ego$geneID), adj_pval = ego$pvalue)
id.fc=rt
genelist <- data.frame(ID = id.fc$gene, logFC = id.fc$logFC)
row.names(genelist)=genelist[,1]

circ <- circle_dat(go, genelist)
termNum = 5                                     #限定term数目
geneNum = nrow(genelist)                        #限定基因数目可以改为数字

chord <- chord_dat(circ, genelist[1:geneNum,], go$Term[1:termNum])
pdf(file="GO_circ.pdf",width = 12,height = 11)
GOChord(chord,
        space = 0.001,           #基因之间的间距
        gene.order = 'logFC',    #按照logFC值对基因排序
        gene.space = 0.25,       #基因名跟圆圈的相对距离
        gene.size = 5,           #基因名字体大小
        border.size = 0.1,       #线条粗细
        process.label = 9)       #term字体大小
dev.off()

####KEGG####
rt=read.table("input.txt",sep="\t",check.names=F,header=T)    #读取文件
genes=as.vector(rt[,1])
entrezIDs <- mget(genes, org.Hs.egSYMBOL2EG, ifnotfound=NA)    #找出基因对应的id
entrezIDs <- as.character(entrezIDs)
out=cbind(rt,entrezID=entrezIDs)
write.table(out,file="KEGG-id.txt",sep="\t",quote=F,row.names=F)    #输出结果


rt=read.table("KEGG-id.txt",sep="\t",header=T,check.names=F)
rt=rt[is.na(rt[,"entrezID"])==F,]
gene=rt$entrezID
#kegg分析
kk <- enrichKEGG(gene = gene,keyType = "kegg",organism = "hsa", pvalueCutoff =0.05, qvalueCutoff =0.05, pAdjustMethod = "fdr")
write.table(kk,file="KEGG.txt",sep="\t",quote=F,row.names = F)

#可视化
##条形图
pdf(file="KEGG-barplot.pdf",width = 10,height = 13)
barplot(kk, drop = TRUE, showCategory = 15,label_format=100)
dev.off()

##气泡图
pdf(file="KEGG-bubble.pdf",width = 10,height = 13)
dotplot(kk, showCategory = 15,label_format=100)
dev.off()

#圈图
ego<-read.table("KEGG.txt",sep="\t",check.names=F,header=T)
go=data.frame(Category ="ALL",ID = ego$ID,Term = ego$Description, Genes = gsub("/", ", ", ego$geneID), adj_pval = ego$p.adjust)
id.fc=rt
genelist <- data.frame(ID = id.fc$entrezID, logFC = id.fc$logFC)
row.names(genelist)=genelist[,1]
row.names(rt)=rt[,3]

circ <- circle_dat(go, genelist)
termNum = 5                                     #限定term数目
geneNum = nrow(genelist)                        #限定基因数目可以改为数字

chord <- chord_dat(circ, genelist[1:geneNum,], go$Term[1:termNum])
sameSample=intersect(row.names(chord), row.names(rt))
rt=rt[sameSample,,drop=F]
geneIDs=rt$gene
row.names(chord)=geneIDs
pdf(file="KEGG_circ.pdf",width = 12,height = 11)
GOChord(chord,
        space = 0.001,           #基因之间的间距
        gene.order = 'logFC',    #按照logFC值对基因排序
        gene.space = 0.25,       #基因名跟圆圈的相对距离
        gene.size = 5,           #基因名字体大小
        border.size = 0.1,       #线条粗细
        process.label = 9)       #term字体大小
dev.off()